Plan for Unit 2, Investor Preferences
Complete Part Two of class project
You will understand the concept of utility. You will learn how to
evaluate different investment options.
Use return data from Jan 2010 to Dec 2016. You will need the last
year to evaluate out-of-sample performance.
The risk free rate is what you computed in Unit 1.
Measure your risk tolerance and your utility
- Do the survey on page 163(20min):
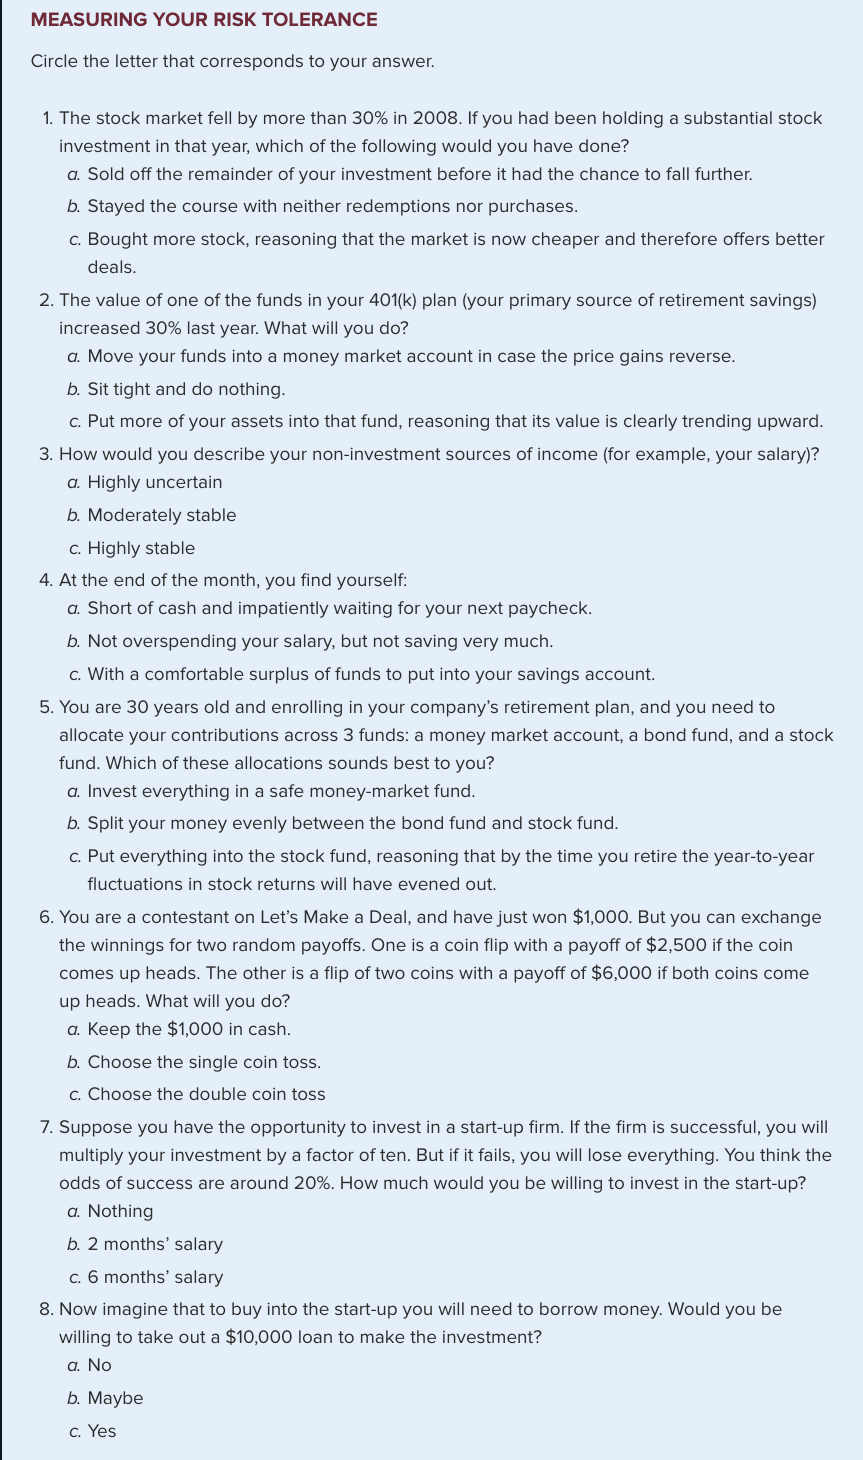
Each answer (a) is 1 point, each answer (b) is 2 points, each answer (c)
is 3 points.
- If you have between 8 and 14 points assign a risk aversion
coefficient of 9. If you have 15, 16, 17, or 18 points, assign a risk
avertion coefficient of 3, and if you have more than 18 points, assign
a risk aversion coefficient of 1. (20min)
- Plot all nine ETF portfolios (use scatter plot in excel) on the
same graph. The Y axis will be return, the X axis standard deviation.
(20min)
- What is Mean-Variance Criterion? What is portfolio dominance? Are there
any industry portfolios on the graph which are dominated by other
portfolios? Describe. (30min)
-
What is your utility as an investor holding each industry portfolio
separately. Which portfolio would you prefer. (40min)
- Plot your indifference curve across this preferred portfolio, on
the same graph on which you plotted all nine portfolios. (50min)
- Together with your teammates, plot the individual team member
indifference curves on the same graph, each indifference curve going
through across each member's preferred portfolio. (40min)
You can invest in one ETF and the risk free rate
- If you can allocate your money between one ETF and the risk free
rate, which ETF will you choose? Why?(30min)
- On the graph on which you have been working, add the best capital
allocation line?(30min)
-
What proportion of your investment should you allocate to the risk
free asset and what proportion should go to the best risky asset (ETF)
that you determined to maximize your utility?(50min)
-
What is your utility at this optimal allocation point? How can you
show that this is indeed the optimal point? (30min)
-
How does your utility compare to the case when there was no risk-free
asset?(20min)
-
On the same graph that you have been working with, plot your new
indifference curve.(30min)
Put together the following summary, based on all the
calculations you've done so far: Compare the utility that
you had when you invested in(50min):
- Just one ETF.
- Just one ETF combined with the risk-free asset.